

Advertisement
Simple Introduction ChartAI
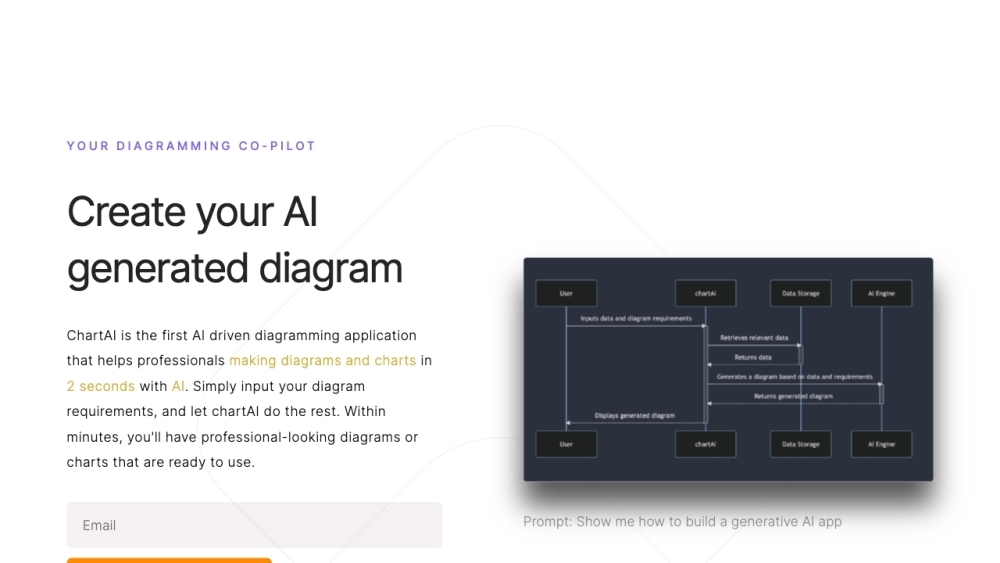
ChartAI effortlessly converts complex data into insightful visualizations with AI-powered automation.
Discover The Practical Benefits
ChartAI is an innovative artificial intelligence solution designed to streamline the process of creating, analyzing, and interpreting data visualizations. This powerful tool is ideal for professionals, academics, and students who require efficient ways to transform complex datasets into clear, meaningful charts. Leveraging cutting-edge machine learning algorithms, ChartAI intelligently determines the optimal chart type for any given dataset, ensuring accurate and insightful representations. Users can import data in multiple formats including CSV, Excel, and JSON, which the system then processes to uncover trends, patterns, and outliers. The platform provides comprehensive customization features, enabling adjustments to visual elements like color schemes, typography, and axis labels. Beyond basic visualization, ChartAI offers sophisticated analytical functions such as predictive analytics and statistical modeling to extract deeper insights from data. Accessible through a browser-based interface, the tool is platform-agnostic and works seamlessly across devices. Collaborative functionality allows teams to work concurrently on projects and share results effortlessly. Whether for corporate reporting, scientific research, or personal data exploration, ChartAI serves as a versatile solution for making data more accessible and insights more impactful.
Advertisement
Probationer
Data Analysts
Saves time on routine visualization tasks while providing advanced analytics.
Business Professionals
Creates presentation-ready charts quickly without design expertise.
Academic Researchers
Helps visualize complex research data for papers and presentations.
Students
Simplifies data interpretation for projects and assignments.
Key Features: Must-See Highlights!
Smart Chart Selection:
AI automatically picks the best chart type for your data.Multi-Format Support:
Accepts CSV, Excel, JSON and other common data formats.Advanced Analytics:
Includes predictive modeling and statistical analysis tools.Customizable Visuals:
Full control over colors, fonts, and chart elements.Collaborative Features:
Enables real-time teamwork on data visualization projects.Advertisement
visit site
FAQS
What types of charts can ChartAI generate?
ChartAI can create various chart types including bar charts, line graphs, pie charts, scatter plots, and more complex visualizations like heatmaps and Sankey diagrams, all automatically selected based on your data characteristics.
Is there a limit to the dataset size ChartAI can process?
While ChartAI can handle substantial datasets, extremely large files may require optimization. The platform provides guidance on preparing data for optimal performance with datasets of all sizes.
Can I export the charts created with ChartAI?
Yes, ChartAI supports multiple export formats including PNG, JPEG, SVG for images, and PDF for documents, making it easy to use your visualizations in presentations or reports.
Top AI Apps


